Since Sam Green’s innovative article in 2012 introducing Expected Goals, the metric has gone on to become one of the most widespread and insightful within football analytics.
This blog serves as a brief recap and overview, looking to explain the metric in context and provide some more recent examples.
Expected Goals (xG) quantitatively measures chance quality, a concept that is widely used in the sport.
Watching a game we can intuitively tell good chances from bad chances based on a variety of factors. How close was the shooter to goal? Was it from a good angle to the goal? Was it a one-on-one? Was it a header?
xG takes these factors – and others – into account and calculates how likely it is that a particular shot will be scored. For example, if a shot with a specific set of characteristics is likely to be scored one time in every 10 it will be worth 0.10 xG. These calculations are based on extensive historical shot data (over 300,000 shots from the Opta database at the time of writing) and are adjusted for different leagues.
*See appendix for a more in-depth explanation of calculation
The metric reflects how we analyse games; the team that creates the higher quality chances is usually who we consider having been ‘the better team’. An xG model gives a quantitative measure to the quality of scoring opportunities and adds additional context to a player or team’s shots that goes beyond raw shot and shot on target totals.
Expected Goals is typically a more consistent measure of performance than actual goals. Whereas goals are relatively rare events that come and go in stretches, a team or player’s xG output tends to fluctuate much less from match-to-match. Clearly the goals that are actually scored are the ones that win points, but xG gives us more context for evaluating team performance.
Understanding a team’s underlying performance
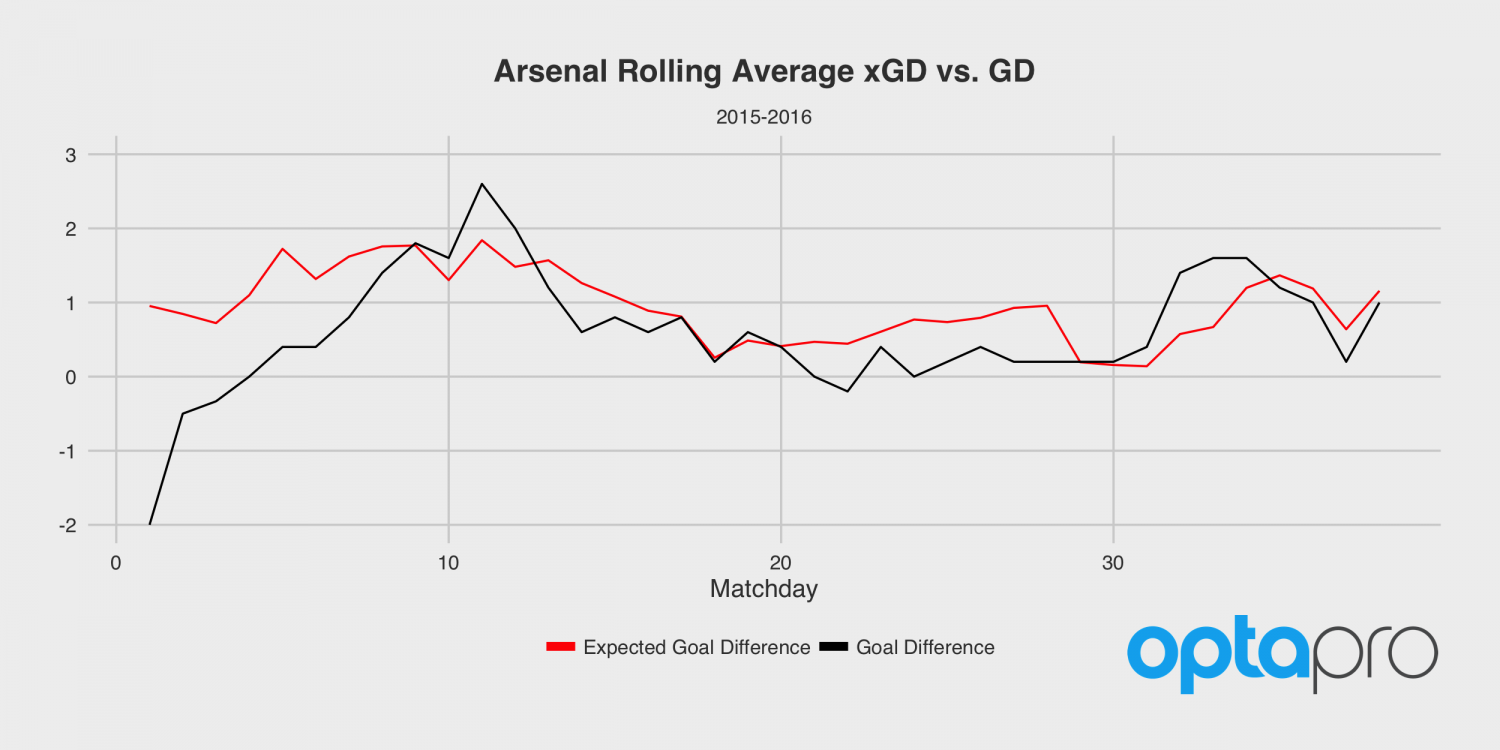
Consider Arsenal at the start of the 2015-16 Premier League season. In their first six games they only scored five goals for an average of 0.83 goals per game. This is a worryingly low number for a team that was expecting to challenge for the title. However, during this period Arsenal had over 12 Expected Goals for an average of 2.11 Expected Goals per game.
By the end of the season Arsenal averaged had 1.71 goals per game, which sits closely alongside their Expected Goals output from the start of the season, compared to their underwhelming goal total from that period.
If we only analysed the goals Arsenal scored in their first few matches of the season we would have never expected them to finish the season with so many goals. However, by looking at their xG we can obtain a much clearer insight into how Arsenal were actually playing.

Understanding a player’s underlying performance
By comparing the goals that a player scored with the chances available to him through xG, we can better understand what is driving that player’s performances. If the xG numbers are significantly below the player’s goal output it may be a sign of an unsustainable run or at least merits further study to understand why this over-performance – compared to the average at least – is happening.

We can also tell a lot about a player’s shot selection through xG. By analysing a player’s average xG per shot we can understand whether he is taking high quality shots or lots of shots from areas from which he is unlikely to score.

Expected goals is an effective tool for evaluating chance quality and predicting future performances both at the player and team level. There is nothing new about the concept of chance quality; Expected Goals assigns a quantitative value to each shot in order to generate more in depth and meaningful analysis.
Appendix
Opta’s xG model is calculated using a logistic regression where the dependent variable is whether or not the shot was a goal and the regression inputs are as follows:
– Passage of play (open play, direct free kick, set play, corner kick, assisted, throw-in)
– Assist type (long ball, cross, through ball, danger-zone pass, pull-back)
– Post-Take–on
– Rebound
– Header
– Distance to goal
– Visible angle of the goal
– 1 v 1
– Big chance
– Competition adjustments for a subset of competitions