NB: all data correct up to and including April 9th, 2012
Introduction
There is an obvious correlation between the number of shots a player takes and the number of goals they will score. Commentators will often espouse a player’s willingness to go for goal, many subscribing to the ‘If you don’t buy a ticket, you won’t win the lottery’ theory: that by peppering the goalkeeper with as many shots as possible, eventually one will go in.
However, from a tactical perspective this can often be a particularly inefficient way of winning games. Shooting from a great distance or from a narrow angle may occasionally result in a goal, but missing the target or putting the ball into the opposition keeper’s arms will hand possession back to the opposition team and all of the hard work done in creating that chance will be for naught. The more often this happens, the more possession is wasted.
So how do we quantify which areas of the pitch are the most likely to result in a goal and therefore, which shots have the highest probability of resulting in a goal? If we can establish this metric, we can then accurately and effectively increase our chances of scoring and therefore winning matches. Similarly, we can use this data from a defensive perspective to limit the better chances by defending key areas of the pitch.
It may seem an obvious factor to analyse: after all, anybody who has watched a football match knows that shots from the centre of the penalty area are more likely to result in a goal, whereas shots from the half way line aren’t. However, the Opta data collected allows for a far more in depth analysis. It also allows us to establish which players are most effective when shooting and which are the least.
This report aims to show how OptaPro can define what makes a good chance as opposed to an average one, which players are more effective than the quality of their chances would suggest and how goalkeepers’ performance can be measured effectively.
What makes a goal?
As noted above, the most basic requirement to score goals is to take shots. Indeed, the Premier League’s top scorer Robin van Persie – the focal point of the Arsenal attack – has attempted more shots this season than any other player which have resulted in 26 goals to his name. So far as expected. However, a glance at the next most frequent shot-takers sees a fairly large disparity in efficiency.
Table 1 Most Shots
| Player | Shots | Mins | Shots per 90 | Goals | Shots per goal | % on Target |
| Robin van Persie | 140 | 2793 | 4.5 | 26 | 5.4 | 47 |
| Clint Dempsey | 131 | 2965 | 4.0 | 16 | 8.2 | 40 |
| Wayne Rooney | 130 | 2349 | 5.0 | 22 | 5.9 | 47 |
| Gareth Bale | 119 | 2767 | 3.9 | 9 | 13.2 | 31 |
| Luis Suárez | 110 | 2198 | 4.5 | 8 | 13.8 | 38 |
Why exactly has Luis Suárez required well over twice as many shots as van Persie to score each of his goals? He, like Van Persie, has often acted as a lone striker for his club. Although it could be argued that the support Suarez has received this season hasn’t been as high a quality as Van Persie’s, this doesn’t alter our analysis as he has still managed to fire off 110 attempted goal-bound efforts. Similarly, even when looking at those players who haven’t played as often as Van Persie but still like to shoot on sight, their goals per shot ratio is less than that of the Arsenal forward.
Table 2 Highest Shot Frequency
| Player | Mins | Shots per 90 | Goals per 90 |
| E Dzeko | 1444 | 5.4 | 0.81 |
| M Balotelli | 1308 | 5.2 | 0.89 |
| W Rooney | 2349 | 5.0 | 0.84 |
| J Defoe | 1170 | 4.6 | 0.77 |
| R van Persie | 2793 | 4.5 | 0.84 |
Min 900 minutes played
Only Wayne Rooney has matched the Dutchman for accuracy. The total number of shots alone doesn’t explain such a large shortfall in goals between the top two scorers and the rest. Clearly we need to look a little deeper and compare the quality of each chance.
Defining Chance Quality
The most obvious factor in determining whether a shot is likely to end up in the crowd, the goalkeeper’s hands or the back of the net is the location of the shot. Establishing where shots are taken from can start to explain the numbers displayed above.
The image below shows the average (mean) location of each of the players listed above in Table 1(represented by their club crest). Although a simple average could be extremely misleading, for the purposes of this exercise it provides an initial demonstration.
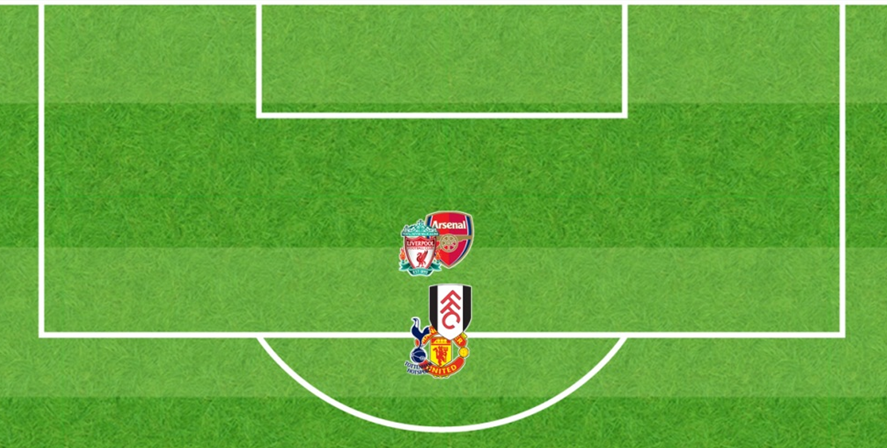
If location is the all-important factor in establishing the likelihood of a shot resulting in a goal Wayne Rooney is clearly getting something very right and/or Luis Suárez something very wrong (I imagine the majority would opt for ‘and’).
However, delving deeper into the numbers can show that while location is one of the most important factors in determining a shot’s quality, it is by no means the only one.
If this statement is considered to any extent all, it quickly makes sense. Clearly a header struck at the penalty spot from a corner will not have the same chance of being a goal as a shot from the same location on the counter attack, or indeed, a penalty.
To account for this disparity, we can construct a model that considers these and other factors to determine a shot’s probability of being on target and/or scored.
Expected Goals (xG)
Utilising this model, we can look at each player’s shots and tally up the probability of each of them being a goal to give an expected goal (xG) value.
Firstly, we can use it to assess the average quality of chance created for each player – or to what extent a player exercises a degree of control over his shot selection and is prepared to either fashion a better chance for himself or spurn an average chance to set up a better-positioned teammate.
Table 3 xG/ Shot Extremes
| Player | Shots | xG | XG/Shot | Goals |
| Darren Bent | 43 | 9.9 | 0.231 | 9 |
| Yakubu | 58 | 12.5 | 0.216 | 14 |
| Emmanuel Adebayor | 90 | 18.1 | 0.202 | 13 |
| Adel Taarabt | 73 | 3.0 | 0.041 | 1 |
| Stilian Petrov | 44 | 1.8 | 0.041 | 4 |
| John Arne Riise | 46 | 1.8 | 0.040 | 0 |
Min 30 Shots
Table 3 would appear to give an early boost to the model’s accuracy. Three 18-yard vulpines (and penalty takers to boot) sit proudly at the top the table and three players who are noted for their willingness to gamble from distance (and, not incidentally, set-piece takers) bringing up the rear.
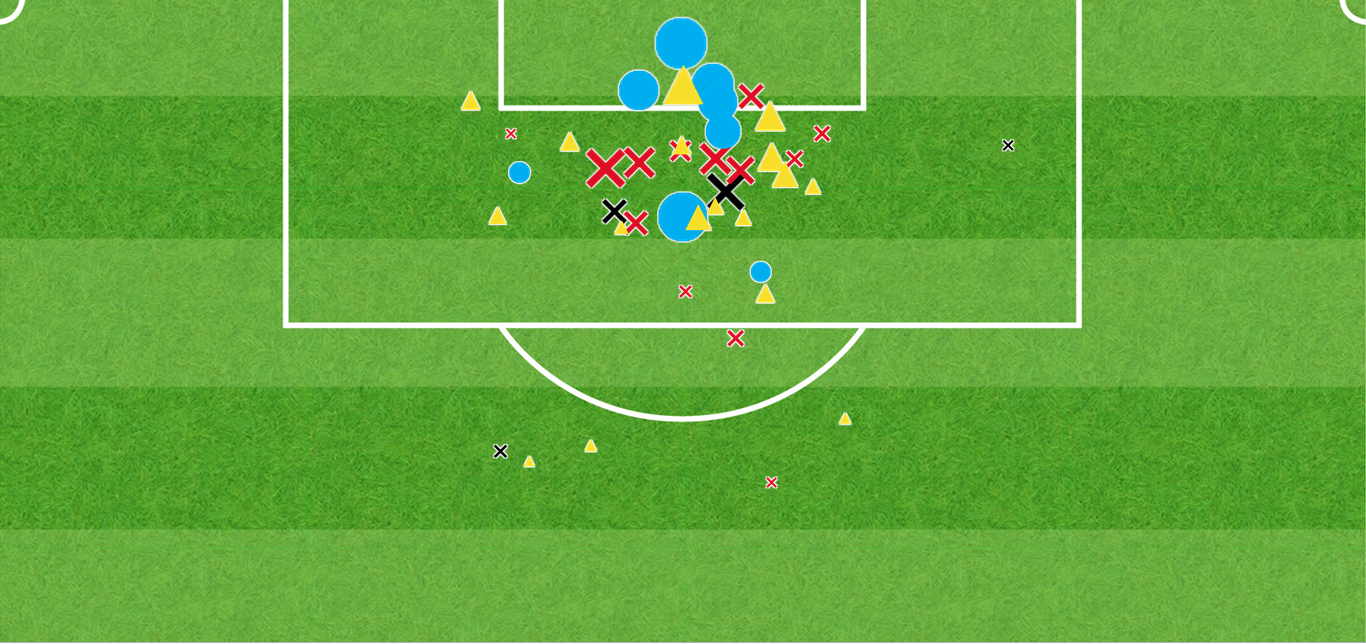
An obvious comparison can be made between the shot maps of the leader (Bent) and one of the players bringing up the rear (Taarabt). These maps quickly highlight the difference in approach:
Darren Bent Shot Map
Adel Taarabt Shot map
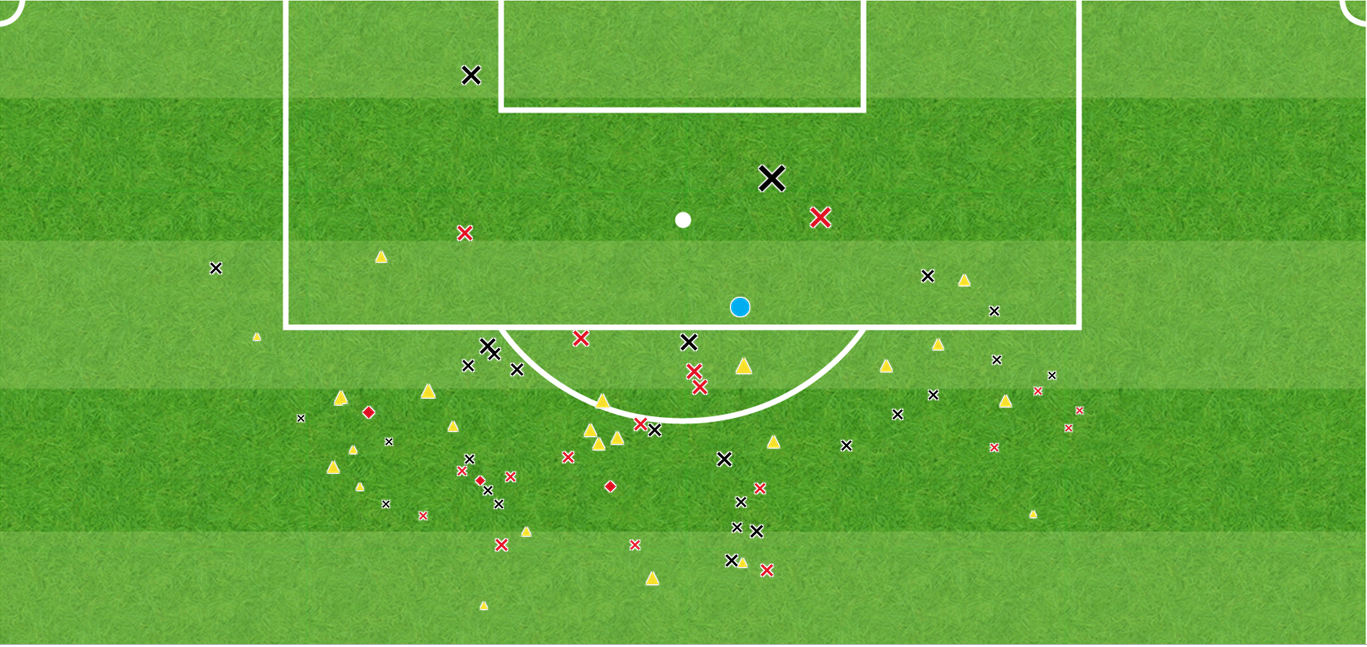
Here, circles represent goals, triangles saves, red crosses off-target shots, black crosses blocked shots and red diamonds shots that hit the woodwork. The size of each mark indicates its goal probability.
The pictures largely tell their own story, with Bent’s ability to get himself in to very dangerous positions – or selectivity- particularly evident in his number of high-quality chances close in front of goal. By contrast, Taarabt’s set-piece duties and willingness to shoot from long range have resulted in far more shots (73 to the Villa striker’s 43) but a much lower xG total (3.0 to 9.9).
Those following closely at home will have noted that both players have failed to match (the model’s) expectations by approximately one goal (Bent) or two (Taarabt). Another of the players with a very high average chance quality, Emmanuel Adebayor, has been amongst the lowest in the league in terms of underperforming in front of goal, as demonstrated by his xG total. Adebayor is one of only four players in the Premier League this season to have a difference (dG) of five goals or more below his expected value. The top and bottom three players are listed in the table below (Liverpool fans, look away now):
Table 4 dG Extremes
| Player | Shots | xG | Goals | dG |
| Papiss Demba Cissé | 25 | 4.5 | 10 | +5.5 |
| Mikel Areta | 43 | 2.8 | 7 | +4.2 |
| Pavel Pogrebnyak | 10 | 1.3 | 5 | +3.7 |
| Andy Carroll | 62 | 9.3 | 3 | -6.3 |
| Dirk Kuyt | 44 | 8.3 | 2 | -6.3 |
| Luis Suárez | 110 | 15.0 | 8 | -7.0 |
There is some good news for the Reds however, with Steven Gerrard leading the way in dG per shot:
Table 5 dG Extremes (rate)
| Player | Shots | xG | Goals | dG | dG/X |
| Steven Gerrard | 30 | 1.8 | 5 | +3.2 | +1.06 |
| Sebastian Larsson | 32 | 3.6 | 7 | +3.4 | +1.05 |
| Adam Johnson | 31 | 1.8 | 5 | +3.2 | +1.05 |
| Andy Carroll | 62 | 9.3 | 3 | -6.3 | -1.01 |
| Tim Cahill | 42 | 5.3 | 1 | -4.3 | -1.02 |
| Dirt Kuyt | 44 | 8.3 | 2 | -6.3 | -1.43 |
Min 30 shots
NB: dG/X – difference between actual and expected goals scored per 10 shots (i.e. Gerrard’s shooting has resulted in a little over one goal more than predicted for every 10 shots taken)Min 30 shots
Apportioning Credit
Thanks to the above analysis, we can now describe which players have over- or under-performed in front of goal. However, we can’t really say why. To attempt to answer this we can look at each shot in further detail.
Specifically, we can consider the goal probability of the shot before and after it is struck (i.e. incorporating the shot’s trajectory) to separate the impact of:
– The chance quality (i.e. how likely the shot was to be a goal, irrespective of how the shot is hit – already established
– The player’s shooting (i.e. the difference between the goal probability before and after the shot is struck
– And the goalkeeper (i.e. whether the shot is saved or not)
By considering the goal probability factoring in the nature of the shot itself, we can attempt to disentangle the effects of shooting and goalkeeping in our dG values derived earlier.
A look at the model’s 2011/12 top performers in terms of shooting reveals the league’s top two scorers, led by Spurs’ Rafael van der Vaart. Andy Carroll’s miserable campaign is once again highlighted, trailing the league in terms of goal probability added through his shooting:
Table 6 SGA Extremes
| Player | Shots | xG | xG(OT) | SGA |
| Rafael van der Vaart | 57 | 6.9 | 10.3 | +3.4 |
| Wayne Rooney | 99 | 18.1 | 21.0 | +3.0 |
| Robin van Persie | 115 | 23.2 | 26.0 | +2.8 |
| Aaron Ramsey | 41 | 5.8 | 3.7 | -2.2 |
| Louis Saha | 45 | 5.6 | 3.4 | -2.2 |
| Andy Carroll | 54 | 9.4 | 6.5 | -2.9 |
SGA – Shooting Goals Added (the difference between goal probability before and after an unblocked shot is struck)
xG(OT) – expected Goals (sum of goal probabilities factoring in the quality of shot)
Table 7 SGA Extremes (rate)
| Player | Shots | xG | xG(OT) | SGA | SGA/X |
| Sebastian Larsson | 27 | 3.9 | 5.7 | +1.9 | +0.69 |
| Rafael van der Vaart | 57 | 6.9 | 10.3 | +3.4 | +0.60 |
| Ivan Klasnic | 25 | 4.1 | 5.5 | +1.4 | +0.56 |
| Andy Carroll | 54 | 9.4 | 6.5 | -2.9 | -0.54 |
| Robert Huth | 27 | 3.8 | 2.2 | -1.7 | -0.62 |
| Chris Brunt | 30 | 3.2 | 1.2 | -2.1 | -0.69 |
Min 25 Unblocked shots
SGA/X – Shooting Goals Added per 10 shots on target
The second part of the shooting model considers the difference between the number of goals scored and the number expected based on the chance quality and shot quality, xG(OT). This should then highlight the players who have been rewarded, or penalised, the most by goalkeeping (bad or good, respectively) and could be described as which players are ‘luckier’ in front of goal than others.:
Table 8 KGA Extremes
| Player | OT | xG(OT) | Goals | KGA |
| Mikel Arteta | 14 | 3.5 | 7 | 3.5 |
| Craig Bellamy | 14 | 2.9 | 6 | 3.1 |
| Adam Johnson | 12 | 2.0 | 5 | 3.0 |
| Dirk Kuyt | 15 | 6.0 | 2 | -4.0 |
| Emmanuel Adebayor | 43 | 17.6 | 13 | -4.6 |
| Luis Suárez | 42 | 13.8 | 8 | -5.8 |
OT -Shots on target
KGA -Keeping Goals Added
So, Mikel Arteta’s appearance near the top of the earlier dG table (+4.2 goals above expectation) appears to be more due to the vagaries of the keeping he has faced than particularly good shot striking. On the flip side, Adebayor and some of the Liverpool players also seen earlier appear to have suffered particularly badly due to some excellent goalkeeping performances over the course of the season, with Luis Suarez arguably denied nearly 6 goals that would, had he faced the keeper on another day, been scored.
Table 9 KGA Extremes (rate)
| Player | OT | xG(OT) | Goals | KGA | KGA/X |
| Mikel Arteta | 14 | 3.5 | 7 | 3.5 | 2.51 |
| Adam Johnson | 12 | 2.0 | 5 | 3.0 | 2.51 |
| Steven Gerrard | 11 | 2.5 | 5 | 2.5 | 2.28 |
| Tin Cahill | 12 | 3.5 | 1 | -2.5 | -2.09 |
| Marouane Fellaini | 14 | 4.4 | 1 | -3.4 | -2.45 |
| Dirk Kuyt | 15 | 6.0 | 2 | -4.0 | -2.70 |
Min 10 shots on target
KGA/X – Keeping Goals Added per 10 shots on target
To illustrate the complete picture we will look at a player whose shooting figures are well above average but still has failed to match or exceed his expected goals value (based on chance quality only), Wigan’s Franco di Santo.
Franco Di Santo Shot Maps
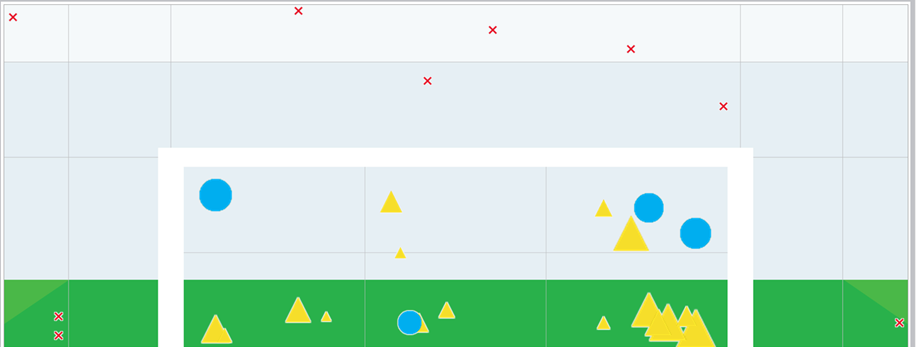
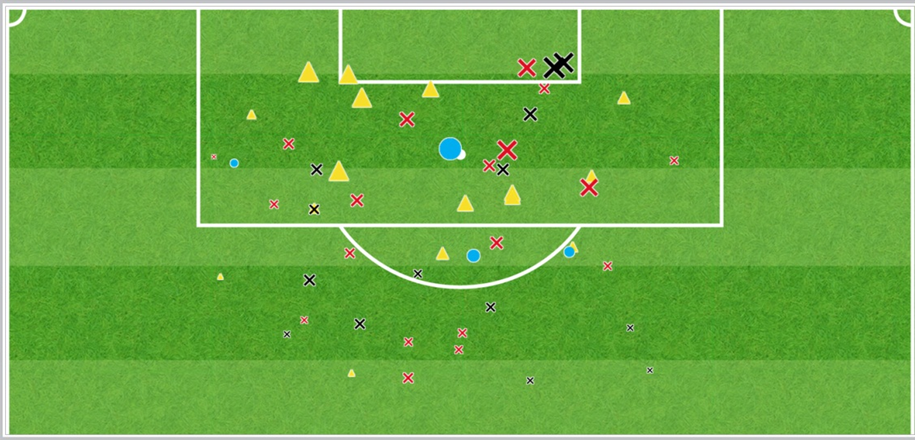
The lower image shows the location of each of his shots in the league as before, with the size determined by the goal probability based on chance quality only (xG). The upper image shows the end location of the shots on the goal mouth, with the size of each mark determined by the goal probability factoring in shot quality.
Not only has di Santo got more than half of his (unblocked) shots on target but, as can be seen from the images, he has been particularly adept at finding the corners, adding 2.2 goals worth of goal probability from his 20 shots on target, to bring his expected value (factoring in shot quality) to 6.2. He has managed to find the net only four times however, suffering from a number of high quality saves. The number of yellow triangles seen in the corners of the ‘goal’ above show that poor Franco has been consistently hitting the corners without gaining anything like the reward he would normally expect.
Keeping
The same approach can naturally be applied to the other side. We can use the same system to see which ‘keepers have prevented the most goals, relative to the quality of shots faced.
The keepers behind two of the more surprising defensive successes of the season top the table of keeping goals added (bear in mind a negative value is a good thing for defensive players), while the much put-upon Paul Robinson brings up the rear.
Table 10 KGA Extremes
| Player | xG(OT) | Goals | KGA |
| John Ruddy | 56.7 | 48 | -8.7 |
| Tim Krul | 49.0 | 42 | -7.0 |
| Joe Hart | 30.4 | 24 | -6.4 |
| Wojciech Szczesny | 32.0 | 36 | +4.0 |
| Patrick Kenny | 38.6 | 47 | +8.4 |
| Paul Robinson | 43.1 | 60 | +16.9 |
Allowing for volume of shots faced drops Tim Krul out of the top three, and lifts David De Gea just above his Manchester counterpart:
Table 11 KGA Extremes (rate)
| Player | xG(OT) | Goals | KGA | KGA/X |
| David De Gea | 28.3 | 22 | -6.3 | -0.58 |
| Joe Hart | 30.4 | 24 | -6.4 | -0.56 |
| John Ruddy | 56.7 | 48 | -8.7 | -0.51 |
| Wojciech Szczesny | 32.0 | 36 | +4.0 | +0.37 |
| Patrick Kenny | 38.6 | 47 | +8.4 | +0.66 |
| Paul Robinson | 43.1 | 60 | +16.9 | +1.21 |
Min 50 shots on target faced
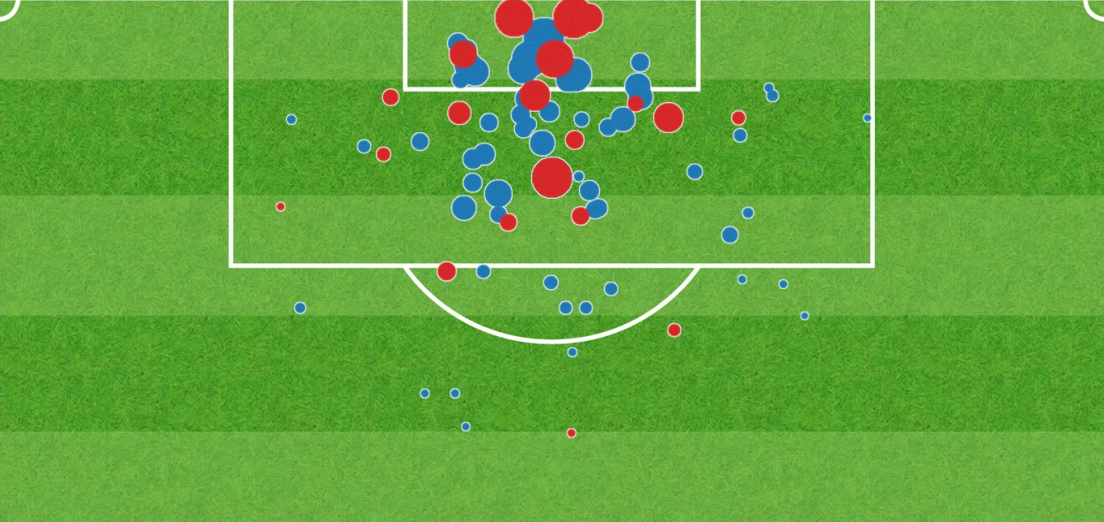
The image below shows the location – and goal probability – of the goals conceded by De Gea (red) and Robinson (blue). The tiny size of many of the circles/shots conceded by Robinson highlights an apparent weakness when facing efforts from distance. However, De Gea demonstrates his obvious quality and athleticism against long range attempts:
De Gea & Robinson Shot Maps (Goals)
Summary
The data explored above only touches on the ability we now possess to explore statistical trends in football. Clearly there are other factors in play here, such as shot power, curl or dip on the shot and whether the goalkeeper is unsighted or off balance. However, as an introductory analysis we can clearly see some results that can explain some of the 2011/2012 season’s defining storylines.
Despite Suarez’s obvious class, he hasn’t scored enough goals for Liverpool. However, using the above analysis we can see that he has been especially unfortunate in front of goal. When his expected Goals per Game ratio from the statistics is highlighted, it is clear that luck has not been on his side especially considering the number of times he has hit the post this season. Similarly, Tim Krul’s excellent shot-stopping abilities have clearly contributed to Newcastle United’s challenge for a Champions League spot while Wojciech Szczesny has apparently contributed to an underperforming Arsenal squad.
By utilising OptaPro’s data and analysis tools, we can effectively view trends that have a definite impact on the narrative of the Premier League season. The old cliche that luck evens itself out over the course of a season could certainly be seen as a red herring.