OptaPro data scientist Will Gürpinar-Morgan shares his debut blog for OptaPro, clustering centre-back passing in the Premier League.
Key takeaways
– Centre backs in the English Premier League are increasingly involved in their team’s possession phase over recent seasons with these trends being particularly prevalent at the ‘Big-6’ clubs
– The major driver of these trends has been passes originating from advanced areas higher up the pitch that either circulate possession or progress the ball into wider areas up-the-pitch
– The evolving change in passing style and proportion has not significantly influenced centre back passing completion rates
Football is a constantly evolving game as the prevalence of different styles and systems wax and wane, coaches come and go, and certain principles become associated with success or failure. Within this the roles and responsibilities of individual players shift; the requirements of a certain position are different to those of even the recent past.
From an analytical perspective, this presents a challenge as profiles and expectations of players change. Broad qualitative statements are possible regarding the greater emphasis on pressing and possession in the modern game but what does that really look like quantitatively? How have overarching trends influenced the players on the ground?
A good example of the shifting responsibilities of players over time is the technical ability required of modern centre backs, with passing skills increasingly prized alongside the defensive side of the position. The following analysis will investigate this by examining trends and patterns in open-play passes by centre backs over the past seven full seasons plus the first half of 2018/19 in the English Premier League.
Values are for starting centre backs with pass volumes calculated per individual player. Pass proportions are calculated at the team level (i.e. they represent the proportion of passes all starting centre backs combined play on an average team).
Passing trends
Over the past seven and a half seasons, the average Premier League centre back has been increasingly involved in their team’s possession phase.

In 2011/12, they were attempting 30 passes per 90 minutes, making up 17% of the total passes by their team. Over the following four seasons these values increased slightly before a significant up-turn; the average Premier League centre back is attempting 40 passes per 90 minutes in the current season (24% of total passes on their team). There has been no clear trend in pass completion rates over this period, although the current season sees the highest rate.
These trends have been apparent at both ends of the table with centre backs at promoted teams and the ‘Big-6’ seeing greater involvement over time, with lower and greater volumes than the average respectively. The increases over the past two and a half seasons have been particularly strong for the ‘Big-6’ clubs with their centre backs attempting 60 passes per 90 minutes this season (25% of total passes on their team) compared to 40 passes per 90 minutes between 2011/12-2013/14 (18-19%). Another clear trend is that centre backs are increasingly playing their passes from higher up the pitch on average over recent seasons, particularly at the ‘Big-6’ clubs.
These changes are not just a consequence of the recent trend towards back-three formations, as the trends are observed across teams that have predominantly featured two centre back systems as well.
Clustering passes
While these top-line numbers paint a general picture of the increased involvement of centre backs in possession, we can dig deeper by exploring the spatial aspects of their passing responsibilities and how these have changed over time. The following analysis uses a machine learning algorithm called k-means clustering to group similar passes together based on the start and end locations of the pass, as well as other features such as whether the pass was headed. Based on evaluating statistical criteria and inspecting the results, we end up with 50 different groups of passes that are referred to as ‘clusters’.
There is generally a large degree of symmetry in the passing clusters, which might suggest that the passing coordinates should be normalised. However, there are often differences in their pass completion rates, as well as nuances in terms of the start and end locations. As a result, their raw coordinates are preserved for the analysis.
The figure below illustrates four of these clusters that are significant features of a centre backs passing makeup. The examples are 100 random passes drawn from the 2018/19 season with the average pass completion rate given for each group above the pitch map. The circular markers show the start location of the pass with the line extending to its end location.

We can see clear symmetries in the passing patterns and envision their typical recipients being the goalkeeper or their central defensive partner. Such passes circulate possession in deeper areas and are generally ‘easy’ passes that are completed most of the time, although errant passes in such areas may well prove costly. Combining the four clusters together shows that these passes are relatively infrequent, with the average centre back attempting approximately 5 per 90 minutes with a small increasing trend over time. Pass completion rates of this grouping have remained stable over time, although their proportional contribution has declined slightly over recent seasons.
The next figure illustrates a further group of clusters characterised by being relatively easy sideways passes that are completed at very high rates. They differ to the previous group of clusters by their pass origin and end locations being higher-up-the-pitch in comparison.

These passes make up a greater proportion of a Premier League centre backs passing armoury, increasing from approximately 11 to over 13 passes per 90 minutes over time. Similar to the deeper passes above, there has been a small decrease in their proportional contribution from 33% to 30%.
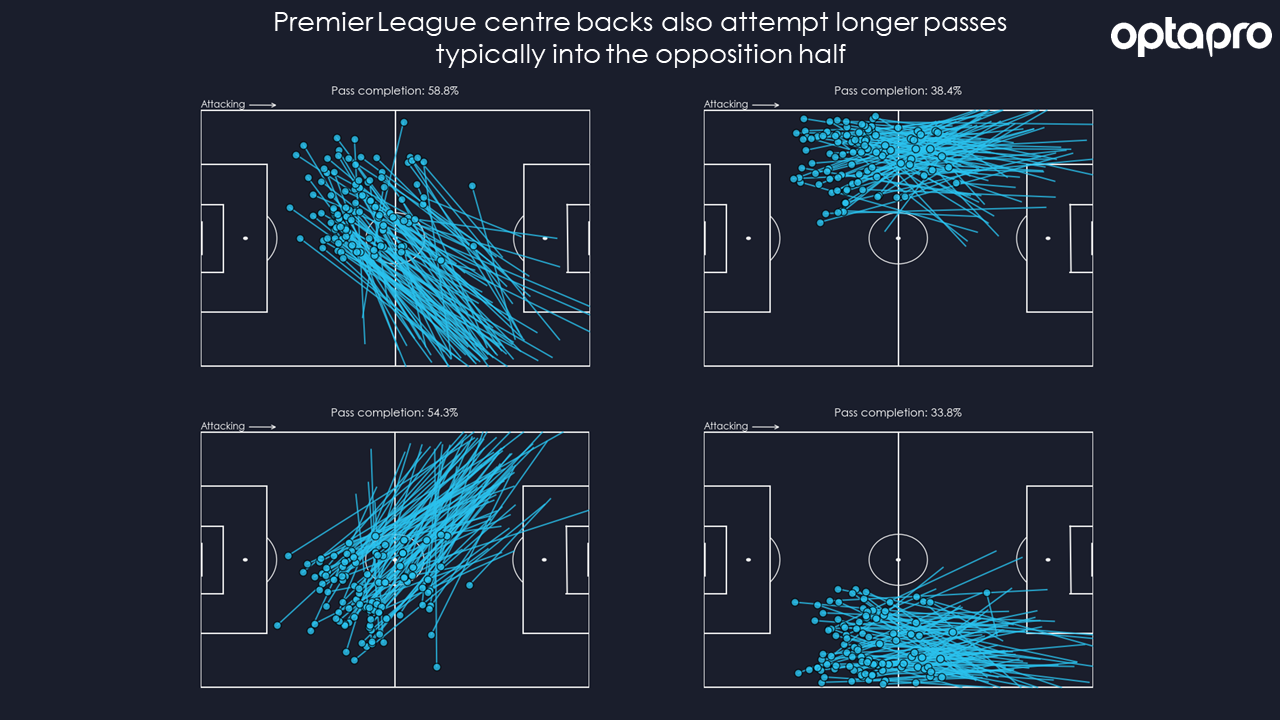
Longer passes principally aimed into the opposition half are illustrated in the following figure, with both diagonal switches of play and vertical passes down the line featured. The length and difficulty of these passes dictates that their completion rates are much lower than the prior examples.

These passes are relatively infrequent as far as the average Premier League centre back goes, with a small increasing trend over time from approximately four to six passes per 90 minutes, with a fairly stable proportion of 13-14%. The longer passes down the line have been completed at similar rates over time, with the longer down the line passes completed at similar rates.
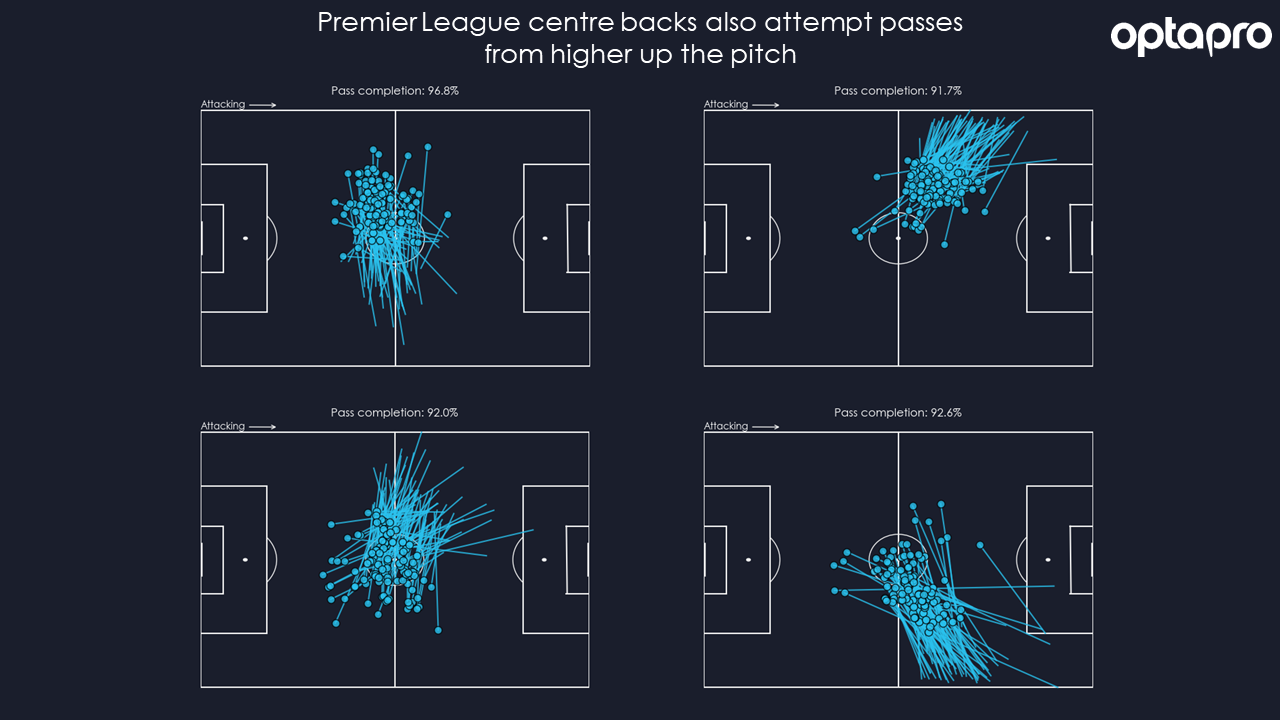
The final figure shows examples of passes originating from more advanced positions higher up the pitch that are completed at rates of 83% or more on average over the past seven and a half seasons. The clusters are characterised by predominantly being made up of sideways passes either into central or wider areas, with some progressing the ball further up the field.

These passes have significantly increased in volume over time from approximately four per 90 minutes in the earlier seasons, reaching close to eight passes in the current season. As well as the upturn in volume, their proportion has also increased from 11% to 17% over time, as has their pass completion rate from approximately 89% to 95%.
Passing responsibility
Overall, the average present-day Premier League centre back is playing a greater role in possession than they were earlier this decade. This is illustrated by both the number of passes they are attempting and completing, as well as their proportional contribution at the team level. The analysis employed above indicates that this has not just been a consequence of playing more easy passes within their own half to circulate possession, as the proportional contribution of such passes has declined over time. Longer passes have been a steady feature over time in terms of their proportional contribution, alongside a steady increase in volume and completion rate.
The major driver of the increased role of the modern Premier League centre back in possession has been passes originating from advanced areas higher up the pitch that either circulate possession in the middle third or progress the ball into wider areas. Such passes have increased in proportion, volume and completion rate significantly over the past seven and a half seasons. These facets are particularly true of elite Premier League teams, which frequently demand that their centre backs take up a high defensive line in and out of possession.
Based on the analysis presented here, the modern Premier League centre back needs to not only be comfortable in possession but be able to direct and progress play from higher up the pitch. Rather than being primarily tasked with mastering the defensive arts, centre backs are increasingly taking on some of the duties that would have previously been the purview of midfielders ahead of them. These requirements are likely applicable across other leagues as well given overarching trends in systems and styles. This analysis framework can also be applied to other positions and roles.
These insights can inform player recruitment and tactical analysis as they can be used to build profiles of players passing tendencies. Furthermore, they provide a template for coach education and player development as the requirements of defensive players evolve over time.