This article is a written version of Ben Torvaney’s 2018 OptaPro Analytics Forum, which aimed to provide a unified model for the effect of league and age on player output. Read Ben’s initial submission here.
Ben’s analyst mentor on this project was Lucy Rushton, Head of Technical Recruitment and Analysis at Atlanta United.
To find out more about submitting a proposal to present at the 2019 OptaPro Analytics Forum, click here
For the 2018 OptaPro forum, I presented a simple, extensible model to estimate the effect of league and age on player output in a variety of metrics. In the process, we also estimate individual player performance. Although it is only applied to league and age here, the model can easily be extended to include other factors on player output such as position and opponent.
Everyone wants to reduce transfer risk. Part of that risk is in the uncertainty in transferring skills from one playing environment to another. We can never say for certain how well a player on team X will perform for team Y. This makes fair comparisons of players in different environments difficult. But what if we could try to remove some of these effects? That is, what if we could put them onto the same scale?
Let’s start by thinking about goalscoring. That is, after all, the only stat that matters. Players transfer between leagues, therefore we can look at how each player’s goalscoring rate changes as they move from one league to the next. By looking at lots of these comparisons we can build up an idea of the effect of each league on goalscoring.
The results broadly conform to intuition and received wisdom; however, they have the advantage of being quantified. I found that the Premier League was the hardest out of a selection of top European leagues to score in, and that it has become increasingly difficult to score in over the past few years. Players in the Premier Leauge are estimated to score goals at around 80% of the rate that they would in Serie A or La Liga. In other words, if a player was scoring 0.5 goals per 90 minutes (a goal every other game) in the Premier League, we’d expect them to score closer to 0.6 goals per 90 in Serie A. Likewise, I found that peak goalscoring occurs from around age 23 to 29, with goalscoring rates estimated at around 10-15% higher than equivalent players at around age 20, or around age 30.
What does this model look like?
Variables involving the number of events in a given period of time are often modelled with the Poisson distribution. This is useful and can think of goalscoring as approximately Poisson distributed, too. Put simply, the Poisson distribution tells us how likely we are to see X events in a set period of time, given a rate parameter (the average number of events in that period of time).
We can use this to come up with a model to achieve our original goal of separating player skill from external effects. We simply model the rate (goals per 90 minutes played) for each player as the product of these different factors:
rate = player skill * age effect * league effect
We then estimate each of these parameters from the data. In this case from a set of goals scored and minutes played for each player in a selection of top European leagues from 2006/07 to 2017/18 (inclusive).
To make things more concrete, let’s go through an example. If we want to make a prediction we can simply take the product of each of these parameters. So to get an estimate of Pierre-Emerick Aubameyang’s goalscoring in 2018/19, we simply take the “player skill estimate” (0.53), the league estimate of (0.84), and the estimated age effect at 29 years old (1.08) and multiply them together. This gives us an estimated goalscoring rate of about 0.48 goals per 90 minutes played.
Age

The band shows the 95% credible interval for each age, with the dark line being the median. The wider the band, the less certain the model is.
Each age parameter is estimated independently of one another. There is nothing in the model forcing the unverted U-shape; the nice, clean curve you see comes entirely from the data. While it’s easy to think of a handful of exceptions, the data is clear: the peak age from goalscoring is from around 23 to 29 years old.
The is also a small, but significant peak around age 20. I have a couple of ideas of what may be driving this. On average, substitutes score at a higher rate than starting player. This is down to a few reasons, most likely due to the advantage of playing against tired opponents, as well as scoreline effects (losing teams score at a higher rate than drawing teams), and tactical effects. I suspect that this could be producing the peak, as young players are frequently brought on as substitutes and are more likely to be played in attacking roles. However, it could also be noise or some other quirk of the data collection, or tactical elements.
League

This plot shows the change in different leagues’ relative effect on scoring over time. A lower value means that players tend to score fewer goals in that league relative to the others.
This data suggests that the Premier League us getting harder to score in over time, while Ligue Un and the Portuguese Liga becoming easier to score in.
It is important to note that this doesn’t necessarily mean that these leagues are worse than the Premier League. How hard a league is to score in is a product of both the league quality as well as the style of the competition. That is, the average number of goals per game.
For instance, over this period, the Bundesliga averaged over 3 goals per game, yet it still finds itself near the middle of the chart. This is because it is a league with lots of high quality players and teams. Meanwhile, the top league in Portugal averaged around 2 goals per game. However, because of the relative strengths of the leagues, players still tend to score more goals per game in Portugal than they would in the other selected leagues.
Players
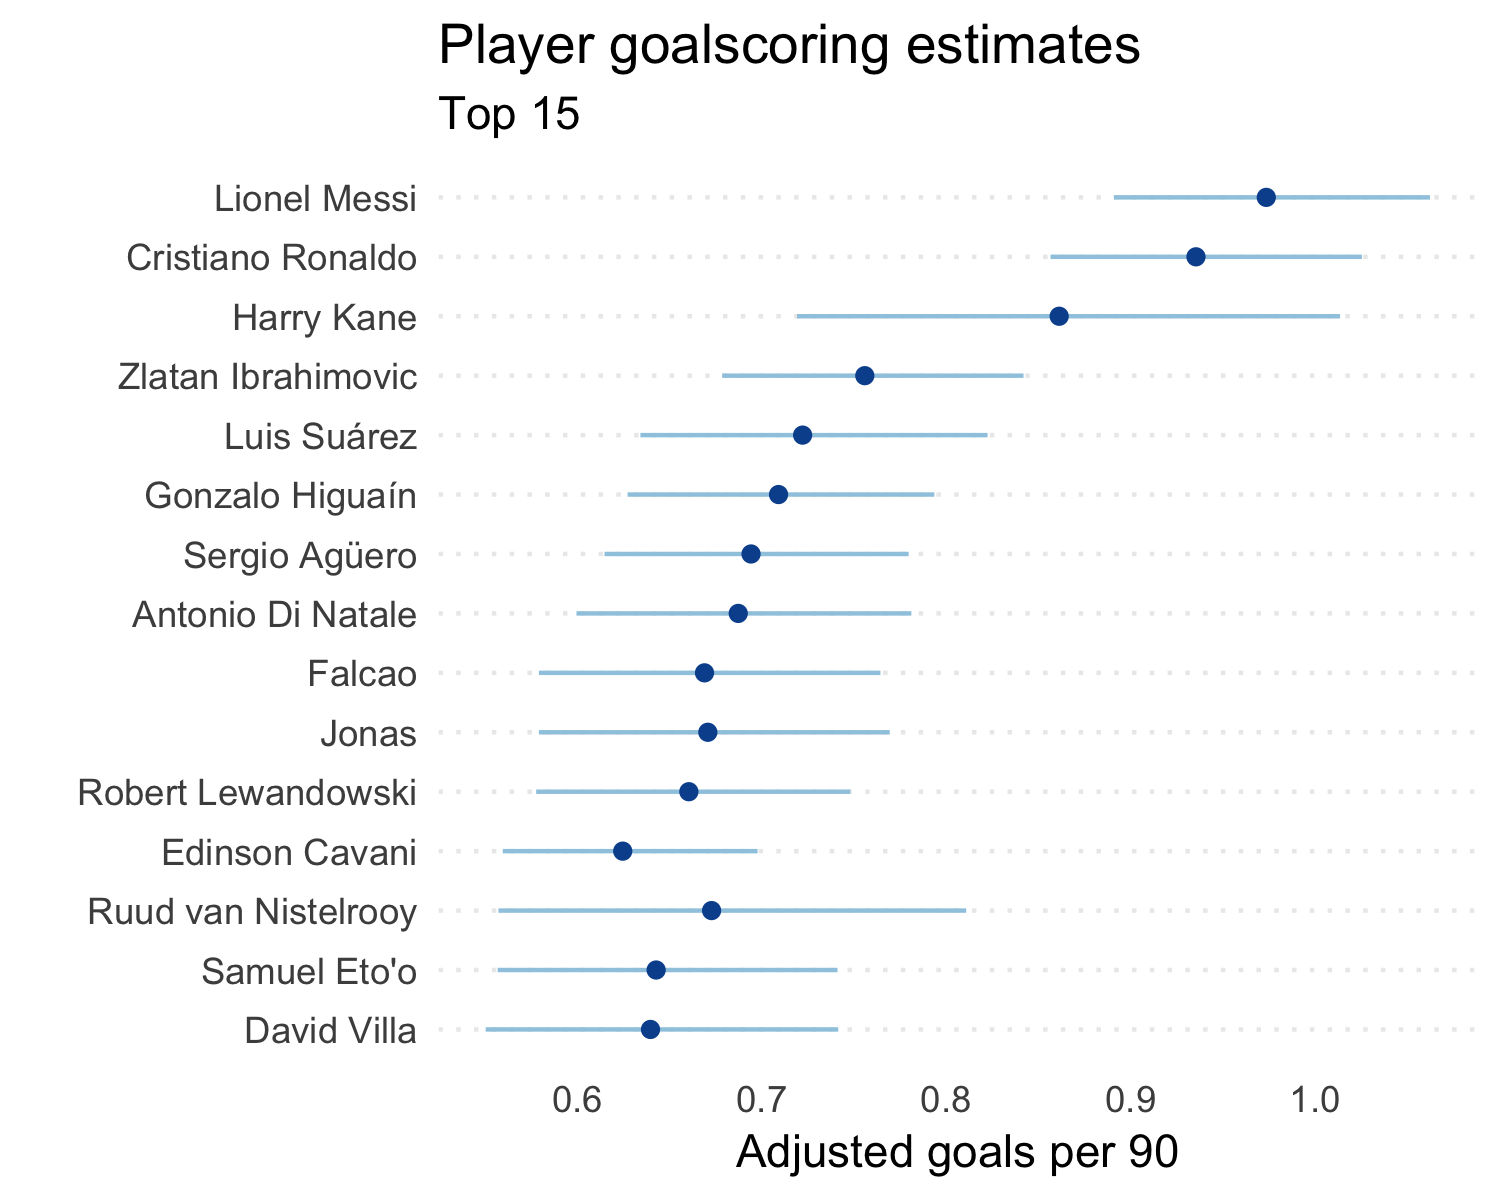
The list of top players seems to line up more or less with intuition; it gets the top two players correct (and in the right order). Interestingly, if you order by median rather than lower bound (as is shown here), Gabriel Jesus comes in at number four (around 0.8). However, because of his age and the smaller number of games played (in Europe, at least), the uncertainty around his true goalscoring ability is much higher than, for example, Harry Kane’s.
We can also see that the list heavily features players that have continued scoring well into the later stages of their careers. I’ll discuss this a bit more when we come to the other statistics.
Other stats?
Of course, there is much more to football than just goals. And there is slightly more to football statistics than just goals. We can apply the same logic that we used to think about comparing goalscoring rates across different ages and competitions to other metrics. I have selected shots, key passes (the pass before a shot is taken, sometimes referred to as a shot-assist), final third passes, and completed take-ons.
These come from a slightly different dataset to the one used for goals. OptaPro provided F9 data (aggregated statistics) for the Premier League, La Liga, Eredivisie, and Football League Championship from 2013/14 to 2016/17 (inclusive).

Again, this seems to match our intuition. We are familiar with seeing players move into deeper positions towards the end of their careers. Meanwhile, take-ons are very much a young player’s game.
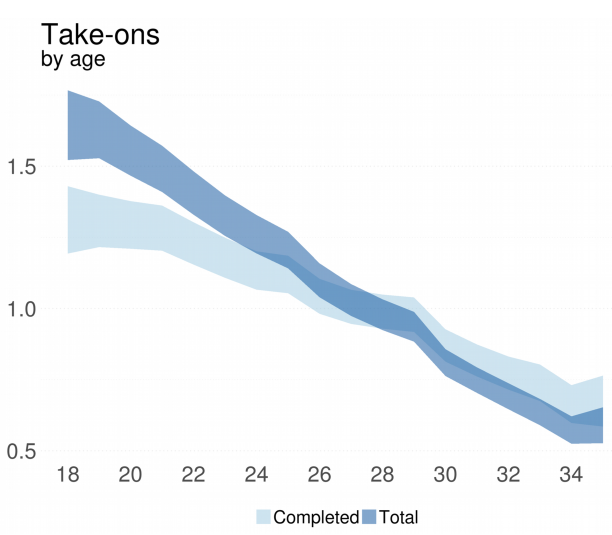
Interestingly, the rate of attempted take-ons does not decline quite as quickly as the rate of completed take-ons. In other words, the completion % of take-ons increases with age. This may be evidence of increasing selectivity and improved decision making as players mature.
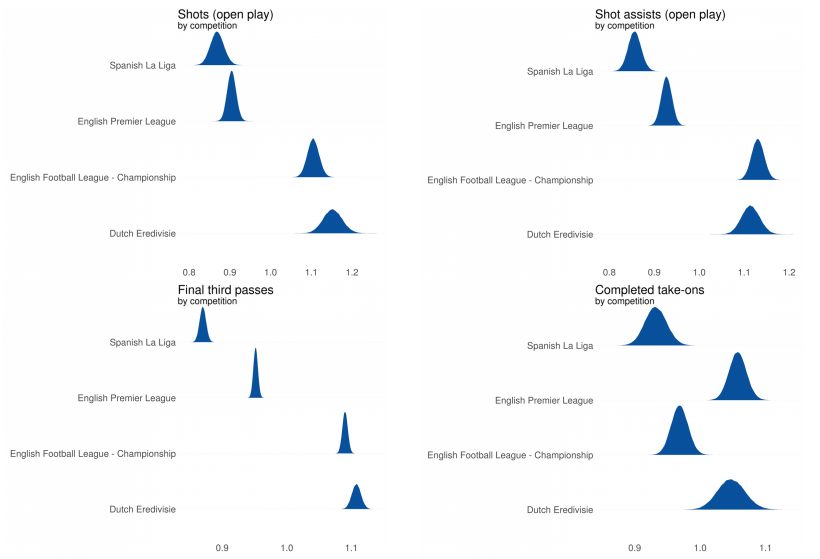
As with goals, the effect above is a mix of both league talent level and league style. The shot-based metrics seem to be more closely related to league quality than final third passes and take-ons.

There are a few more surprising names here than there were in the goals-only model. However, I think this can be explained by the age curve combined with the more limited amount of data time-wise. For example, the model only ‘sees’ Wes Hoolahan at a relatively late stage of his career. Because he put up very high numbers relative to other players of a similar age, the model assumes he was world-beating at his peak.
Extending the model
The multiplicative formula at the heart of the model makes it simple extend by simply adding extra factors to estimate. One area that could be particularly fruitful would be accounting for in-game effects. For instance, time of the game and scoreline. We know that teams tend to score at a higher rate at the end of games and when they are losing. Accounting for this could help improve the accuracy of age and individual player estimates.
Another area for improvement could be to personalise the age curves. In other words, treat the ability to perform earlier or later in a career than an average player as a distinct skill from goalscoring (or shot generation, passing, etc.). This might alleviate some of the age bias we saw in the top player lists we saw earlier.
View the slides from Ben’s presentation
Follow Ben (@Torvaney) on Twitter