The opening of this transfer window has seen an unusual amount of focus on goalkeepers. Petr Cech has swapped Chelsea for Arsenal, and now Chelsea are out for a replacement to backup Thibaut Courtois. There have been stirrings of Manchester United losing David de Gea and discussion of whether they would be better served shopping for a new number one or relying on Victor Valdes in the event de Gea does leave.
Though not as exorbitant as the 50-million-pound-plus fees mentioned in rumors involving names such as Paul Pogba and Kevin de Bruyne, the fees for goalkeepers have been part of the focus on their transfers. Some rate Petr Cech as a bargain, while others think Arsenal wildly overpaid. This is a clear illustration of how hard consensus is to come by when it comes to evaluating goalkeepers’ skill and justifying a price.
In evaluating goalkeepers, there are at least two intuitive and pretty basic areas in which we already subjectively evaluate goalkeepers. One is shot-stopping ability – how well do they prevent opponents who have goalscoring chances from converting those chances? The other area could be broadly labelled as chance prevention and includes things such as how often and how successfully they cut out crosses and through balls or claim aerial threats in the box. For now I sought to look at shot-stopping ability via the Keeping Goals Added metric.
While goals and save percentages make sense as a basic starting point for goalkeepers, they leave out a lot of information such as how likely the keeper was to stop a shot in the first place. If a keeper fails to stop a one-on-one attempt, we probably wouldn’t consider them at fault as much as with a longer shot. Conveniently, expected goals captures a lot of this information, so as we’ve done in the past, I calculated the number of goals each keeper allowed, as well as the number of goals the expected goals model predicted they would concede (based only on shots on target). I took the difference between the two to arrive at the Keeping Goals Added. In this case, I also adjusted by a constant to account for the tendency of the expected goals model to under-predict total number of goals when summed. The result is Adjusted Keeping Goals Added (aKGA) a number which indicates how many more or fewer goals a goalkeeper conceded than what they would be expected to concede based on the quality of the shots they faced. I filtered my dataset to keepers who had faced at least 50 shots on target in either year (2013/14 and 2014/15) to make the results more meaningful.
While this statistic represents a good way to assess cumulative value, it’s hard to compare across keepers who have faced a different number of shots on target. A keeper who faces more will have more chances to accumulate value in an additive statistic (this also means that having a good keeper is more valuable to teams allowing many shots on target). As in our previous analysis, I adjusted for shot volume by using aKGA per 10 shots on target faced. This gives a better representation of what we might think of as skill in shot stopping. The distribution of aKGA per 10 SoT over the last two years looks like this:
Distribution of aKGA per 10 shots on target, 2013/14 – 2014/15
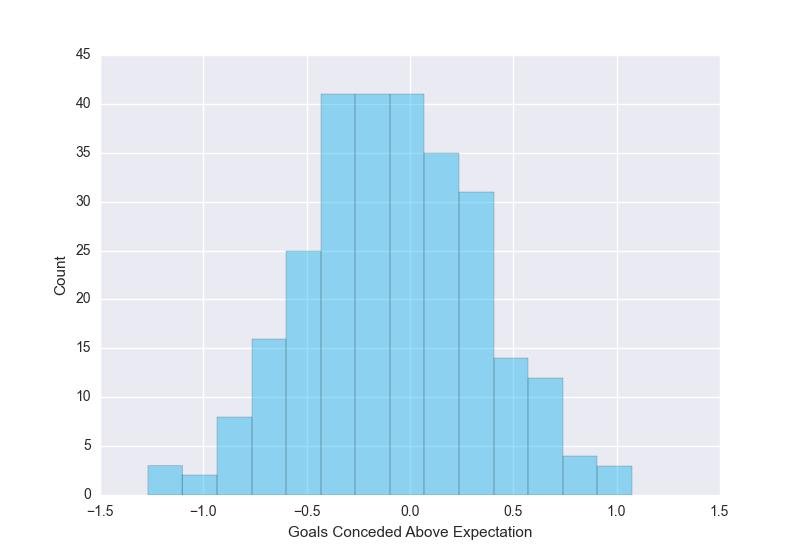
Here negative numbers represent good performance. The top 15 performances across the two seasons are shown:
Top 15 performances, 2013/14 – 2014/15
| Player Name | Year | Team | Mins | Goals Against | SOT faced | xG Against | kGA | akGA | AkGA / 10SOT |
| Jasper Cillessen | 2013 | Ajax | 2205 | 12 | 80 | 21.325 | -9.325 | -10.144 | -1.268 |
| Gianluigi Buffon | 2013 | Juventus | 2868 | 18 | 104 | 29.369 | -11.369 | -12.188 | -1.172 |
| Claudio Bravo | 2014 | Barcelona | 3330 | 17 | 88 | 25.962 | -8.962 | -9.781 | -1.111 |
| David Ospina | 2014 | Arsenal | 1620 | 11 | 57 | 16.303 | -5.303 | -6.122 | -1.074 |
| Manuel Neuer | 2013 | FC Bayern München | 2745 | 16 | 87 | 23.703 | -7.703 | -8.522 | -0.98 |
| David Ospina | 2013 | Nice | 2570 | 23 | 125 | 33.609 | -10.609 | -11.428 | -0.914 |
| Jasper Cillessen | 2014 | Akax | 2880 | 24 | 141 | 35.928 | -10.928 | -11.747 | -0.833 |
| Vito Mannone | 2013 | Sunderland | 2567 | 35 | 165 | 47.922 | -12.922 | -13.741 | -0.833 |
| Boaz Myhill | 2014 | West Bromwich Albion | 934 | 17 | 73 | 22.2 | -5.2 | -6.019 | -0.825 |
| Danijel Subašić | 2013 | Monaco | 3150 | 28 | 126 | 37.534 | -9.534 | -10.353 | -0.822 |
| Bram Castro | 2014 | Heracles Almelo | 1080 | 15 | 57 | 18.838 | -3.838 | -4.657 | -0.817 |
| Tann Sommer | 2014 | Borussia Mönchengladbach | 3060 | 25 | 149 | 36.306 | -11.306 | -12.125 | -0.814 |
| Danijel Subašić | 2014 | Monaco | 3330 | 23 | 104 | 30.22 | -7.22 | -8.039 | -0.733 |
| Vincent Enyeama | 2013 | Lille | 3420 | 25 | 120 | 33.202 | -8.202 | -9.021 | -0.752 |
| Eloy Room | 2014 | Vitesse | 2430 | 30 | 122 | 37.985 | -7.985 | -8.804 | -0.722 |
Seeing David Ospina score well across two seasons with different teams is rather interesting, given that Arsenal felt the need to buy some competition (or perhaps even a replacement) for him. Vito Mannone’s high rating is echoed by his selection as Sunderland’s official player of the year for 2013-14. However, in the most recent campaign he performed worse, rating at -0.306 akGA per 10SOT over 52 shots on target, and was dropped for Costel Pantilimon, who performed at a respectable -0.504 .
A key issue not fully addressed by our past analysis of kGA is repeatability. If goalkeepers who outperform their expected goals totals are unable to sustain this performance, then the metric isn’t capturing skill so much as luck. I examined this by looking at the 69 keepers who faced at least 50 shots in each of the 2013/14 and 2014/15 seasons.
Persistence of kGA/10SOT
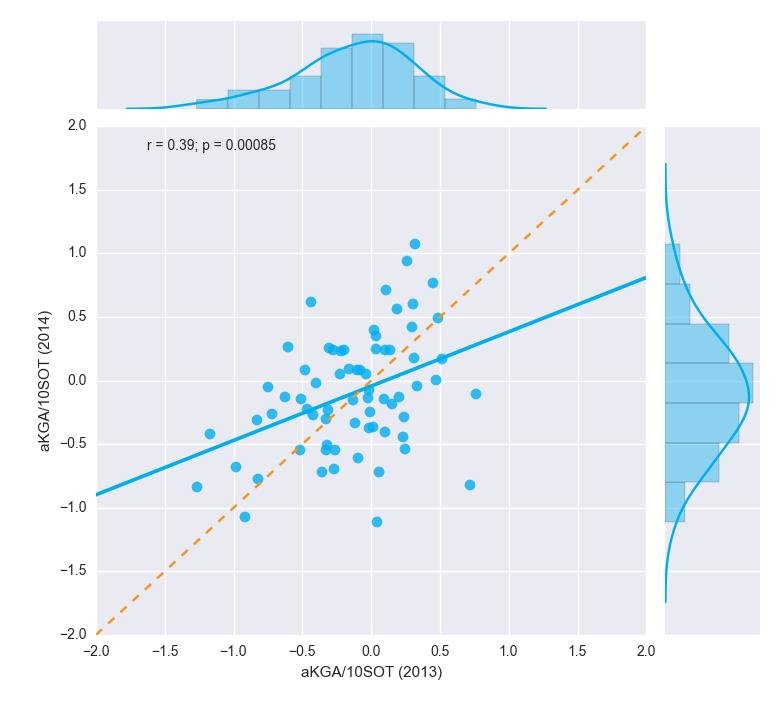
Here the orange line represents what would be a perfect 1:1 relationship between keeping goals added in the two years plotted. The blue line is the actual best fit, with an R-squared value of 0.183. This does not make an overwhelming case for the repeatability of akGA / 10 SOT. Though the coefficient of regression of the first year’s effect on the second year’s value is statistically significant and positive, the relatively low explanatory power seems to indicate that we haven’t quite isolated shot-stopping ability through the noise. So while we can look retroactively and assign value to what a keeper has done based on this metric, it’s hard to assess transfers when the available information on the past seems to give us little to say about the future.